Web Intelligence and Big Data Unit 3 & 4 PYQ
Web Intelligence and Big Data Unit 3 & 4 PYQ
1 (a) How the data from different universe/ sources and projects can be combined in a single reports. Explain. (6)
In order to combine data from different universes, sources, or projects into a single report, several techniques can be employed. Here's an explanation of how this can be done:
Data Integration: Data integration involves gathering data from various sources and unifying it into a consistent format. This can be achieved through Extract, Transform, Load (ETL) processes, where data is extracted from different sources, transformed to a standardized format, and loaded into a central repository or data warehouse.
Data Mapping: Data mapping is the process of matching and aligning data elements from different sources to ensure compatibility. It involves identifying common fields or attributes in the datasets and establishing relationships between them. This allows for a coherent merging of data into a single report.
Data Cleansing: Data cleansing is crucial to ensure the accuracy and consistency of the combined data. It involves identifying and correcting any errors, inconsistencies, or duplicates in the datasets. By cleaning the data, we can enhance the reliability and quality of the final report.
Data Transformation: Data transformation involves converting data into a common format or structure. This may include standardizing units of measurement, formatting dates and times, or aggregating data at different levels of granularity. By transforming the data, we can ensure that it can be effectively analyzed and presented in the report.
Data Visualization: Once the data is integrated and transformed, it can be visualized using various techniques such as charts, graphs, and tables. Data visualization helps in presenting complex information in a clear and concise manner, enabling users to derive insights and make informed decisions.
By employing these techniques, data from different universes, sources, or projects can be combined effectively, allowing for comprehensive and integrated reporting. It enables organizations to gain a holistic view of their data, identify patterns, trends, and relationships, and make data-driven decisions.
(b) What is MapReduce? Due to which characteristics it is called as programming model for handling large datasets? Explain the terms YARN, HDFS, Init, Mapper, Shuffle and sort Reducer with reference to MapReduce. (6.5)
MapReduce is a programming model that is designed for processing and analyzing large datasets in a distributed computing environment. It consists of two main stages: the Map stage and the Reduce stage. MapReduce is often used in conjunction with the Hadoop framework, which provides the necessary infrastructure to execute MapReduce jobs.
Characteristics of MapReduce that make it suitable for handling large datasets are as follows:
Scalability: MapReduce is highly scalable, allowing it to process and analyze massive amounts of data by distributing the workload across multiple machines in a cluster. This enables efficient processing of large datasets in parallel.
Fault tolerance: MapReduce is designed to handle failures that may occur in a distributed computing environment. It automatically handles failures by redistributing the workload to other available nodes, ensuring that the computation continues without interruption.
Terms related to MapReduce:
YARN (Yet Another Resource Negotiator): YARN is a key component of the Hadoop ecosystem. It is responsible for resource management and job scheduling in a Hadoop cluster. YARN enables efficient allocation of resources to different MapReduce tasks, ensuring optimal utilization of cluster resources.
HDFS (Hadoop Distributed File System): HDFS is a distributed file system that provides reliable and scalable storage for big data applications. It breaks the data into blocks and replicates them across multiple machines in the cluster to ensure fault tolerance and high availability.
Input: In the MapReduce model, the input to a job is divided into fixed-size splits, with each split being processed by a separate mapper.
Mapper: The mapper is responsible for processing the input data and generating intermediate key-value pairs. Each mapper operates on a subset of the input data, applying a specific computation or transformation.
Shuffle and Sort: After the mappers have completed their tasks, the intermediate key-value pairs are shuffled and sorted based on the keys. This process groups together all the values associated with each unique key.
Reducer: The reducer receives the shuffled and sorted key-value pairs as input and performs the final aggregation or computation. The reducer combines the values associated with each unique key and produces the final output of the MapReduce job.
MapReduce, along with its associated terms such as YARN, HDFS, Init, Mapper, Shuffle and Sort, and Reducer, provides a powerful framework for processing and analyzing large datasets in a distributed computing environment. It allows for efficient and fault-tolerant processing of big data, enabling organizations to derive valuable insights and make data-driven decisions.
Q2 (a) Differentiate between the classification and clustering process with suitable example. Enlist at least two classification and two clustering techniques.
Classification and clustering are two fundamental processes in data analysis, but they serve different purposes. Let's differentiate between them and provide examples of each:
Classification:
Classification is a supervised learning process where the goal is to assign predefined labels or categories to input data based on their features.
It requires a labeled dataset where the input data points are already assigned to specific classes or categories.
Classification algorithms learn from the labeled data to build a model that can predict the class labels of new, unseen data.
Example: Email spam detection is a classic example of classification. Given a dataset of emails labeled as "spam" or "not spam," a classification model can be trained to predict whether incoming emails are spam or not based on their content, subject, or other features.
Classification techniques: Decision trees, logistic regression, support vector machines (SVM), naive Bayes, k-nearest neighbors (KNN).
Clustering:
Clustering is an unsupervised learning process where the goal is to group similar data points together based on their inherent similarities or patterns.
It does not require labeled data or predefined categories; instead, it aims to discover the underlying structure or relationships within the data.
Clustering algorithms partition the data into groups or clusters based on the similarity of their features or proximity in the data space.
Example: Customer segmentation in marketing is an example of clustering. Given a dataset of customer attributes such as age, income, and buying behavior, clustering algorithms can group customers with similar characteristics to identify distinct market segments.
Clustering techniques: K-means clustering, hierarchical clustering, DBSCAN (Density-Based Spatial Clustering of Applications with Noise), Gaussian mixture models (GMM).
Classification is about assigning predefined labels to data based on known patterns, while clustering aims to discover natural groups or patterns in unlabeled data. Classification requires labeled data, whereas clustering works with unlabeled data and identifies similarities or patterns based on data proximity or features.
(b) Explain the ETL process in brief and its advantages in brief. Why missing values needs to be treated? Explain the integration and transformation process.
ETL stands for Extract, Transform, and Load. It is a process used in data warehousing and business intelligence to extract data from various sources, transform it into a consistent format, and load it into a target database or data warehouse. Here's a brief explanation of each step:
Extract: In the extraction phase, data is collected from different sources, such as databases, files, APIs, or web scraping. The goal is to gather the relevant data needed for analysis or reporting.
Transform: Once the data is extracted, it undergoes transformation operations. This involves cleaning the data, handling missing or inconsistent values, converting data types, and applying various rules or calculations to derive new information. Transformation ensures data integrity, quality, and consistency.
Load: After the data is transformed, it is loaded into the target database or data warehouse. This step involves organizing the transformed data into appropriate tables or structures to support querying and analysis.
Advantages of the ETL process:
Data Integration: ETL allows data from multiple sources, which may be in different formats or structures, to be integrated and consolidated into a unified view. This enables efficient analysis and reporting by providing a comprehensive and consistent dataset.
Data Cleansing: ETL includes data cleansing and normalization, which helps identify and rectify errors, inconsistencies, and missing values. This improves data quality and accuracy, ensuring reliable insights and decision-making.
Scalability: ETL processes can handle large volumes of data efficiently. By extracting, transforming, and loading data in batches or in parallel, ETL systems can handle data at scale, making them suitable for big data environments.
Historical Data: ETL processes can capture and preserve historical data. By extracting data from different time periods, organizations can perform trend analysis, track changes over time, and make informed decisions based on historical patterns.
Missing values treatment:
Missing values in data can arise due to various reasons such as data entry errors, system failures, or intentional omissions. It is important to treat missing values before analysis because they can impact the accuracy and reliability of insights. Missing values can be handled through techniques such as deletion (removing rows or columns with missing values), imputation (replacing missing values with estimated values), or using advanced techniques like predictive modeling to fill in missing values based on patterns in the data.
Integration and Transformation:
Integration refers to the process of combining data from different sources, which may have varying formats, structures, or data types. It involves mapping the data elements from different sources to a common schema, ensuring consistency and compatibility.
Transformation involves applying various operations to the integrated data to make it suitable for analysis or reporting. This may include data cleansing, normalization, aggregation, calculation of derived measures, or applying business rules. Transformation ensures that the data is accurate, consistent, and aligned with the desired format for analysis.
Hence, ETL process plays a crucial role in data management by enabling the integration, cleansing, and transformation of data, resulting in reliable and consistent data for decision-making.
Q3 (a) What is HBase? "HBase is a data model designed to provide quick random access to huge amounts of structured data". Do you agree with this statement? Justify.(6)
HBase : HBase is a distributed, column-oriented database that runs on top of the Hadoop Distributed File System (HDFS). It is designed to handle large-scale, structured data and provides real-time read and write access to the data.
Yes, I agree with the statement. Here's the justification:
- HBase is designed to handle huge amounts of data, ranging from terabytes to petabytes. It can scale horizontally by adding more servers to the cluster, allowing it to accommodate large datasets.
- HBase provides quick random access to data due to its columnar storage structure. It stores data in column families, and each column can be accessed independently, enabling fast retrieval of specific data.
- HBase supports high throughput and low-latency operations, making it suitable for applications that require real-time access to data.
- With its built-in replication and fault-tolerant architecture, HBase ensures data availability and reliability, even in the face of hardware failures or network issues.
(b) Differentiate between HBase and HDFS and explain the meaning of horizontally scalability characteristics of HBase. How Storage Mechanism works in HBase? Explain. (6.5)
Differentiation between HBase and HDFS:
HBase: HBase is a distributed, column-oriented database built on top of Hadoop. It provides random real-time read/write access to large-scale structured data. It is designed for high performance and low-latency operations. HBase organizes data into tables with rows and columns, similar to a traditional database, and provides efficient random access to specific data using row keys.
HDFS: HDFS (Hadoop Distributed File System) is a distributed file system designed for storing and processing large datasets across a cluster of computers. It is highly fault-tolerant and can handle large files by splitting them into smaller blocks and distributing them across multiple nodes in the cluster. HDFS is optimized for streaming data access and provides high throughput for large-scale data processing.
Meaning of horizontally scalability characteristics of HBase:
Horizontal scalability in HBase refers to the ability to add more servers (nodes) to the HBase cluster to handle increased data volume and workload. As the data and workload grow, additional servers can be added to distribute the data and processing across multiple nodes, resulting in increased storage capacity and improved performance. This allows HBase to scale out horizontally, accommodating larger datasets and handling higher traffic without sacrificing performance.
Storage mechanism in HBase:
- HBase stores data in a distributed manner across the nodes in the cluster. It uses HDFS as the underlying storage layer, which means the data is divided into blocks and distributed across multiple data nodes. Each HBase table is split into regions, and each region is stored on multiple data nodes for fault tolerance and data availability.
- Within each region, data is stored in columnar fashion, with columns grouped into column families. Each column family can have multiple columns, and data within a column family is stored together on disk. This columnar storage allows for efficient retrieval of specific columns.
- HBase also employs a write-ahead log (WAL) mechanism to ensure data durability and recovery in the event of failures. When a write operation is performed, it is first logged in the WAL before being written to the actual data files. This provides data consistency and allows for recovery in case of failures.
The storage mechanism in HBase utilizes distributed storage and columnar organization to achieve high scalability, fault tolerance, and efficient data retrieval.
Q4 (a) Explain the Architecture of Web intelligence and clearly show Database Layer, Semantic Layer and Presentation Layer. Also differentiate between three layers.
The architecture of Web intelligence consists of three layers: the Database Layer, Semantic Layer, and Presentation Layer. Each layer plays a distinct role in the overall functioning of Web intelligence systems. Here is an explanation of each layer and their differences:
Database Layer:
- The Database Layer is responsible for storing and managing the data used in Web intelligence systems.
- It typically consists of a relational database or a data warehouse that stores structured data.
- Data in this layer is organized in tables with rows and columns, and it can be queried using SQL (Structured Query Language).
- The Database Layer provides a foundation for data storage, retrieval, and management.
Semantic Layer:
- The Semantic Layer sits between the Database Layer and the Presentation Layer, acting as a bridge that connects the two.
- It is responsible for adding meaning and context to the raw data stored in the Database Layer.
- The Semantic Layer includes various components, such as ontologies, metadata, and semantic models, that define the relationships and semantics of the data.
- It provides a way to represent and understand the data in a more meaningful and structured manner.
- The Semantic Layer enables advanced functionalities, such as data integration, data enrichment, and semantic querying.
Presentation Layer:
- The Presentation Layer is the user-facing layer of the Web intelligence system.
- It is responsible for visualizing and presenting the insights and information derived from the data in a user-friendly format.
- The Presentation Layer includes various components, such as dashboards, reports, charts, and graphs.
- It enables users to interact with the data, explore different views, and gain insights through visual representations.
- The Presentation Layer focuses on delivering information and insights to users in a clear and understandable way.
Differences between the three layers:
Database Layer: The Database Layer is primarily concerned with data storage, management, and retrieval. It stores structured data in tables and supports SQL queries for data manipulation.
Semantic Layer: The Semantic Layer adds meaning and context to the data stored in the Database Layer. It defines the relationships, semantics, and ontologies that enable advanced functionalities like data integration and semantic querying.
Presentation Layer: The Presentation Layer focuses on visualizing and presenting the data and insights derived from the Database and Semantic Layers. It provides user-friendly interfaces, such as dashboards and reports, to enable users to interact with the data and gain insights.
The Database Layer manages the data, the Semantic Layer provides meaning and context to the data, and the Presentation Layer delivers the insights to users in a user-friendly manner
(b) Explain the functioning of Query engine and wrapper manager in brief. (6.5)
In the context of Web intelligence, the Query Engine and Wrapper Manager play crucial roles in data retrieval and integration. Here's a brief explanation of their functioning:
Query Engine:
- The Query Engine is responsible for processing user queries and retrieving relevant data from the underlying databases or data sources.
- It acts as an interface between the user and the data sources, allowing users to express their information needs through queries.
- The Query Engine interprets the user queries and generates optimized execution plans to retrieve the required data efficiently.
- It handles query optimization techniques, such as query rewriting and query planning, to enhance the performance of data retrieval.
- The Query Engine may also support additional functionalities like query caching, result ranking, and relevance scoring to improve the overall user experience.
Wrapper Manager:
- The Wrapper Manager is a component that facilitates the integration of data from various heterogeneous sources.
- It acts as an intermediary between the Query Engine and the data sources, providing a unified interface for accessing diverse data.
- The Wrapper Manager handles the complexity of interacting with different data sources, which may have different access methods and protocols.
- It employs wrappers, which are specialized software components or modules, to establish connections with specific data sources and retrieve the relevant data.
- The Wrapper Manager manages the communication, data transformation, and data mapping between the Query Engine and the data sources.
- It ensures that the data retrieved from different sources is compatible and can be seamlessly integrated into a unified view for further processing.
So, the Query Engine processes user queries and retrieves data from the underlying data sources, while the Wrapper Manager handles the integration of heterogeneous data sources and provides a unified interface for data retrieval. Together, these components enable seamless data access and integration in Web intelligence systems.
Q5 Write short note on following: (Any Three)
(a) Online advertising
Online advertising refers to the practice of promoting products or services through digital platforms, such as websites, social media, search engines, and mobile apps.
It involves displaying ads to targeted audiences based on various factors like demographics, browsing behavior, and interests.
Online advertising offers several advantages, including the ability to reach a global audience, precise targeting, real-time tracking and analytics, and the flexibility to optimize campaigns based on performance.
(b) Machine translation
Machine translation is the process of automatically translating text or speech from one language to another using computer algorithms.
It involves the use of artificial intelligence and natural language processing techniques to analyze and translate linguistic content.
Machine translation systems can be rule-based, statistical, or based on neural networks, and they continuously improve through machine learning.
Machine translation has made significant advancements in recent years but still faces challenges related to accuracy, context understanding, and idiomatic expression
(c) Natural language understanding
Natural language understanding (NLU) is a branch of artificial intelligence that focuses on enabling computers to comprehend and interpret human language.
It involves algorithms and techniques that enable machines to analyze and understand the meaning, context, and intent behind natural language text or speech.
NLU is essential for applications like virtual assistants, chatbots, voice recognition systems, and sentiment analysis.
NLU systems use techniques such as semantic analysis, syntactic parsing, named entity recognition, and sentiment analysis to extract meaning and gain insights from human language.
(d) Sentiment mining
Sentiment mining, also known as sentiment analysis, is the process of extracting subjective information and sentiments from text or speech.
It involves analyzing and categorizing opinions, emotions, and attitudes expressed in user-generated content, such as social media posts, customer reviews, and survey responses.
Sentiment mining techniques use natural language processing and machine learning algorithms to automatically classify texts as positive, negative, or neutral.
It finds applications in areas like brand monitoring, market research, customer feedback analysis, and reputation management.
(e) Personalized medicine
Personalized medicine refers to a medical approach that tailors healthcare decisions and treatments to an individual's unique characteristics, including their genetic makeup, lifestyle, and medical history.
It aims to provide more accurate diagnoses, predict disease risks, and deliver targeted treatments that are more effective and safer for each patient.
Personalized medicine relies on advancements in genomics, bioinformatics, and data analytics to analyze large datasets and identify personalized treatment options.
It has the potential to revolutionize healthcare by improving patient outcomes, reducing adverse effects, and optimizing resource allocation.
6 (a) Differentiate between Reactive Intelligence, Predictive Intelligence and web intelligence.
Reactive Intelligence, Predictive Intelligence, and Web Intelligence are different approaches to handling and processing information in various contexts. Here's a brief differentiation between these three concepts:
Reactive Intelligence:
- Reactive Intelligence refers to an AI system or agent that responds to stimuli in real-time without any internal model of the world.
- It reacts to immediate inputs and outputs based on predefined rules or patterns.
- Reactive systems lack memory or the ability to learn from past experiences.
- Examples include simple automation systems or basic decision-making algorithms that respond to specific triggers.
Predictive Intelligence:
- Predictive Intelligence involves using data and algorithms to make predictions about future outcomes or events.
- It uses historical data and patterns to forecast possible future scenarios or trends.
- Machine learning models, statistical techniques, and data mining are commonly used in Predictive Intelligence.
- Examples include weather forecasting, stock market prediction, or recommendation systems in e-commerce.
Web Intelligence:
- Web Intelligence is a subfield of Artificial Intelligence that focuses on extracting knowledge and insights from web data.
- It involves the use of data mining, machine learning, and natural language processing to analyze web content, user behavior, and interactions.
- Web Intelligence aims to improve web search, personalized content delivery, sentiment analysis, and user experience.
- Examples include search engines like Google, personalized content suggestions on social media platforms, and chatbots.
Reactive Intelligence is focused on immediate responses without learning or memory, Predictive Intelligence deals with forecasting future events based on data, and Web Intelligence specializes in extracting valuable information from web-related data and user interactions. Each of these approaches serves different purposes and plays a vital role in various AI applications.
(b) Explain the Locality Sensitive Hashing and its utilities.
Locality Sensitive Hashing (LSH) is a technique used in computer science and data mining to approximate nearest neighbor search efficiently. It is particularly useful when dealing with high-dimensional data and large datasets. LSH aims to hash data points in such a way that similar points are more likely to end up in the same bucket or hash bin, making it easier to find approximate nearest neighbors.
Key steps in the Locality Sensitive Hashing process:
Hashing: LSH applies hash functions to data points, mapping them into hash codes or buckets.
Locality Sensitivity: Similar data points are more likely to be mapped to the same bucket, increasing the probability of finding approximate nearest neighbors.
Trade-off: LSH introduces a trade-off between recall (the probability of finding true nearest neighbors) and precision (the probability of false positives).
Utilities of Locality Sensitive Hashing:
Nearest Neighbor Search: LSH is highly efficient for approximate nearest neighbor search in large high-dimensional datasets. It reduces the computational cost compared to exact methods like linear search or brute-force algorithms.
Similarity Search: LSH is useful for finding similar items in recommendation systems, content-based searches, and information retrieval tasks.
Clustering: LSH can be applied to cluster similar data points efficiently, as it groups points with similar hash codes in the same cluster.
High-dimensional Data: LSH is particularly valuable for handling high-dimensional data, where traditional distance metrics may become less effective due to the curse of dimensionality.
Dimensionality Reduction: LSH can be seen as a dimensionality reduction technique, as it maps high-dimensional data points to lower-dimensional hash codes.
Scalability: LSH is highly scalable and suitable for large-scale datasets, making it applicable in big data and real-time systems.
Privacy Preservation: LSH can be used in privacy-preserving techniques like secure multi-party computation to approximate results without revealing sensitive information.
Locality Sensitive Hashing is a powerful technique that enables efficient and effective data retrieval in high-dimensional spaces, making it a valuable tool for various data mining, machine learning, and information retrieval applications.
7 (a) What is damping parameter with reference to Page Rank Searching?
In the context of PageRank, the damping parameter (usually denoted as "d") is a crucial factor that determines the probability of a user continuing to follow links on a web page, rather than jumping to a completely different page. PageRank is the algorithm used by Google to rank web pages in search results based on their importance or relevance.
The damping parameter is set to a value between 0 and 1. Typically, it is set to around 0.85, which means there is an 85% chance that a user will continue to follow links on the current page, and a 15% chance that they will jump to a random page on the web.
The damping parameter is essential to prevent issues like dead ends and spider traps, where a user gets stuck in a loop and cannot navigate to other parts of the web. By introducing a damping factor, the algorithm ensures that there is a small probability of randomly jumping to other pages, which breaks the cycle and allows users to explore different parts of the web.
The PageRank equation with the damping factor is given by:
PR(A) = (1 - d) + d * (Sum of (PR(I) / C(I)) for all pages I linking to page A)
Here, PR(A) represents the PageRank score of page A, d is the damping factor, PR(I) is the PageRank score of page I, and C(I) is the number of outbound links from page I.
By including the damping factor, PageRank produces more accurate and relevant results, reflecting the true importance of web pages and ensuring a better user experience during web searching.
7 (b) Explain the functioning of any page rank searching algorithm.
The PageRank algorithm is used by search engines, particularly Google, to rank web pages based on their importance and relevance. The algorithm assigns a numerical score, called PageRank, to each web page, representing its authority and popularity on the web. Pages with higher PageRank are considered more important and are likely to appear higher in search engine results. Here's how the PageRank algorithm works:
- Link Analysis: PageRank is based on the idea that a web page's importance can be determined by the number and quality of links pointing to it. Pages with more incoming links from other reputable and high-ranking pages are considered more valuable.
- The Damping Factor: As mentioned earlier, the algorithm uses a damping factor (usually set to 0.85) to model the behavior of users when following links. The damping factor ensures that there is a small probability (15%) that a user will randomly jump to any page on the web, breaking potential loops and ensuring better exploration of the web.
- Iterative Process: The PageRank calculation is an iterative process. Initially, all web pages are assigned an equal PageRank score. Then, in each iteration, the algorithm updates the PageRank scores based on the link structure of the web. The process continues until the PageRank scores converge to stable values.
- Calculation of PageRank: The PageRank score of a web page is calculated by considering the PageRank scores of the pages linking to it. Pages with higher PageRank scores pass on more "voting power" to the pages they link to. The algorithm considers the quality and relevance of the incoming links, so links from high-ranking pages contribute more to a page's PageRank.
- Importance of Outbound Links: The PageRank of a page is also affected by the number of outbound links it has. Pages with too many outbound links dilute their PageRank, while pages with fewer outbound links retain more of their voting power.
- Importance of Authority Pages: Pages with high PageRank themselves carry more weight when linking to other pages. Getting a link from a high-authority page can significantly boost a page's own PageRank.
- Continuous Update: As the web evolves and new pages are added or existing pages change, the PageRank algorithm continuously updates the PageRank scores to reflect the changing link structure and importance of pages.
By using the PageRank algorithm, search engines can provide more relevant and valuable search results to users, leading to a better overall search experience. However, it's important to note that PageRank is just one of many factors used in search engine algorithms, and other factors like content relevance and user behavior also play significant roles in ranking web pages.
7 (c) How fusion of social intelligence is merged with business intelligence. Explain.
Fusion of social intelligence with business intelligence refers to the integration of data and insights from social media and other social platforms into the business decision-making process. It involves combining the information gathered from social media interactions, user behaviors, and sentiments with the traditional business data to gain a comprehensive understanding of customers, competitors, and market trends. Here's how the fusion is achieved:
Social Media Listening and Monitoring: Business intelligence tools are used to gather and analyze data from various social media channels, such as Facebook, Twitter, LinkedIn, Instagram, etc. This includes monitoring brand mentions, customer feedback, product reviews, and other relevant conversations on social platforms.
Sentiment Analysis: Text analytics and natural language processing techniques are applied to social media data to determine the sentiment of customers towards the brand or products. This helps businesses gauge customer satisfaction and identify areas for improvement.
Customer Profiling: Social intelligence provides valuable insights into customer demographics, interests, preferences, and behavior patterns. This information is combined with traditional customer data to create comprehensive customer profiles, enabling businesses to tailor their products and marketing strategies more effectively.
Competitor Analysis: Social media data is used to monitor competitor activities, campaigns, and customer interactions. This helps businesses gain a competitive edge by identifying gaps in the market and understanding the strengths and weaknesses of their competitors.
Trend Identification: Social media is a rich source of real-time information on the latest trends and topics of interest to consumers. By analyzing social data, businesses can identify emerging trends and adapt their strategies accordingly to stay relevant in the market.
Influencer Marketing: Social intelligence helps businesses identify influential individuals or social media accounts that have a significant impact on their target audience. Collaborating with these influencers can amplify brand reach and drive engagement.
Social Customer Support: Businesses can use social intelligence to offer proactive customer support by responding to queries, complaints, and feedback in real-time. This enhances customer satisfaction and builds brand loyalty.
Data Integration: The social intelligence data is integrated with the existing business intelligence infrastructure, which includes data warehouses, analytics platforms, and reporting tools. This ensures that social insights are combined with other business data to provide a holistic view of the organization's performance.
Therefore the fusion of social intelligence with business intelligence allows companies to make data-driven decisions, gain a deeper understanding of their customers, and respond to market trends more effectively. It helps businesses stay agile and competitive in a rapidly evolving digital landscape.
8 (a) What is the difference between HBase and BigTable?
HBase and BigTable are both distributed NoSQL databases designed to handle large-scale data storage and processing. However, they have some differences:
Platform and Vendor:
- HBase: HBase is an open-source Apache project and is part of the Hadoop ecosystem. It is developed and maintained by the Apache Software Foundation.
- BigTable: BigTable is a proprietary database developed and managed by Google. It is a key component of Google Cloud Bigtable, which is a fully managed and scalable NoSQL database service provided by Google Cloud.
Data Model:
- HBase: HBase is based on the Bigtable data model, which is a sparse, distributed, and multi-dimensional sorted map. It stores data in rows and columns and allows dynamic column addition, making it schema-flexible.
- BigTable: BigTable also uses the Bigtable data model and is essentially the same in terms of data organization.
Availability and Deployment:
- HBase: HBase is available as open-source software and can be deployed on any Hadoop-compatible cluster.
- BigTable: BigTable is a cloud-based service provided by Google Cloud Platform. It is fully managed by Google and requires no infrastructure management from the user.
Performance:
- HBase: HBase is known for its scalability and can handle massive amounts of data. It is designed for high read and write throughput, making it suitable for real-time applications.
- BigTable: BigTable is also highly scalable and optimized for high-performance data processing. It is designed to handle large-scale, analytical workloads.
8 (b) How the web intelligence is created? Explain.
Web Intelligence is created through the process of Web Mining, which involves discovering, extracting, and analyzing valuable information and patterns from web data. The process of creating web intelligence includes the following steps:
- Data Collection: Web data is collected from various sources on the internet, including websites, social media platforms, forums, blogs, and other online repositories. Data collection can be done using web crawlers, APIs, or data scraping tools.
- Data Preprocessing: Raw web data is often noisy, unstructured, and may contain irrelevant information. Data preprocessing involves cleaning the data, removing duplicates, handling missing values, and converting unstructured data into a structured format suitable for analysis.
- Data Storage: The collected and preprocessed web data is stored in a data repository, such as a database or a data warehouse, for further analysis.
- Data Integration: Web data is integrated with other relevant data sources, such as customer data, sales data, or market data, to gain a comprehensive view of the business environment.
- Data Analysis: Various data mining and machine learning techniques are applied to the integrated web data to extract patterns, trends, and insights. This analysis helps in understanding user behavior, market trends, and customer preferences.
- Visualization and Reporting: The analyzed data is visualized using charts, graphs, and dashboards to make it easier for decision-makers to understand and interpret the findings. Reports are generated to present the web intelligence in a concise and actionable manner.
- Continuous Monitoring: Web intelligence is not a one-time process. It requires continuous monitoring and updating as new data becomes available. This ensures that businesses stay up-to-date with changing market conditions and customer preferences.
Web Intelligence plays a crucial role in various industries, including e-commerce, digital marketing, social media analysis, sentiment analysis, and competitive intelligence. It enables businesses to make data-driven decisions, gain a competitive edge, and better understand their customers and markets.
9 (a) How the Neural Networks? Draw a neat diagram to explain the functioning of Neural network.
Neural networks are a type of artificial intelligence modeled after the human brain's neural structure. They consist of interconnected nodes (artificial neurons) organized in layers. The three main layers in a neural network are the input layer, hidden layers, and the output layer.
Input Layer: This layer receives the input data and passes it to the next layer for processing.
Hidden Layers: These are intermediate layers between the input and output layers. Each node in a hidden layer performs computations on the input data using weighted connections and activation functions.
Output Layer: This layer produces the final result or prediction based on the computations performed in the hidden layers.
Here's a diagram illustrating the functioning of a simple feedforward neural network:
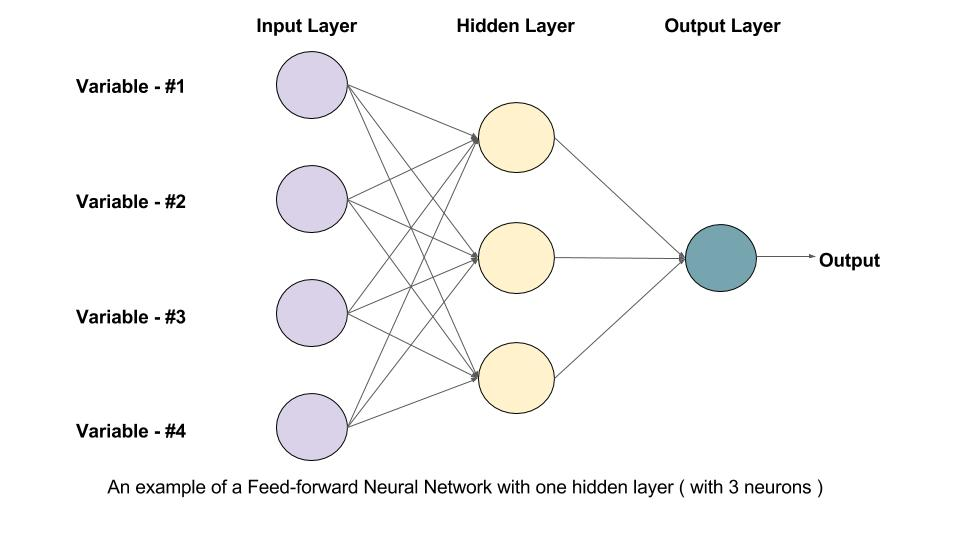
In this diagram, each node in the input layer is connected to each node in the first hidden layer, and each node in the hidden layers is connected to each node in the subsequent layer until the output layer. The connections have associated weights that determine the importance of the input in the computation. The hidden layers use activation functions to introduce non-linearity and allow the network to learn complex patterns from the data. The output layer produces the final prediction.
9 (b) What do you mean by Deep Learning? How it is different from Neural Network.
Neural networks and deep learning are related but not the same:
Neural Network:
- A neural network is a type of machine learning model inspired by the structure of the human brain.
- It typically consists of a single hidden layer and is used for simple tasks like linear regression or binary classification.
- Neural networks are shallow and may not be able to handle complex problems effectively.
Deep Learning:
- Deep learning is a subset of machine learning that uses deep neural networks with multiple hidden layers.
- Deep learning models are designed to learn hierarchical patterns and representations from the data.
- They excel at complex tasks, such as image recognition, natural language processing, and playing games.
- Deep learning requires more data and computational power than traditional neural networks.
Deep learning is a specialized form of neural networks with multiple hidden layers, capable of learning intricate patterns from vast amounts of data, making them powerful tools for a wide range of applications.
10 (a) Enlist few Feature Subset Selection algorithms and explain any one of them in brief. (6)
Feature Subset Selection Algorithms:
- Sequential Forward Selection (SFS): Starts with an empty set of features and iteratively adds one feature at a time based on a selected criterion, such as classification accuracy or cross-validation error.
- Sequential Backward Selection (SBS): Starts with the full set of features and iteratively removes one feature at a time based on a selected criterion.
- Recursive Feature Elimination (RFE): Utilizes the model's weights or importance scores to eliminate the least significant features in each iteration.
- Genetic Algorithms (GA): Employs concepts from natural selection to create and evolve feature subsets based on a fitness function.
One of the Feature Subset Selection algorithms is Sequential Forward Selection (SFS):
Sequential Forward Selection (SFS):
SFS is a greedy algorithm that starts with an empty set of features and adds one feature at a time. It repeatedly selects the best feature that improves the performance of the model, based on a chosen evaluation metric (e.g., accuracy, F1-score, etc.). The process continues until a predefined number of features or desired performance level is achieved.
Here's a brief explanation of the SFS algorithm:
- Initialize an empty set to store the selected features.
- For each feature in the dataset, evaluate its individual performance with the model (e.g., using cross-validation) and choose the one with the highest performance.
- Add the selected feature to the feature set.
- Iterate through the remaining features and evaluate their performance when combined with the previously selected features. Choose the best additional feature that improves the model's performance the most.
- Add the newly selected feature to the feature set.
- Repeat steps 4 and 5 until the desired number of features or performance level is achieved.
The SFS algorithm effectively explores the feature space and selects the most relevant features, leading to improved model performance and reduced computational complexity.
10 (b) Differentiate between classification and Regression. Give suitable example. (6.5)
Classification:
- Classification is a type of supervised learning where the goal is to categorize data into predefined classes or labels.
- It deals with discrete output, meaning the predicted output belongs to a specific category or class.
- The performance of a classification model is evaluated using metrics like accuracy, precision, recall, F1-score, etc.
- Example: Spam email detection, image classification, sentiment analysis (positive/negative sentiment).
Regression:
- Regression is also a type of supervised learning, but it deals with continuous output, not discrete classes.
- It aims to predict a numerical value based on input features, rather than assigning data to categories.
- The performance of a regression model is evaluated using metrics like mean squared error (MSE), mean absolute error (MAE), etc.
- Example: Predicting house prices based on features like area, number of rooms, etc., predicting a person's income based on education and experience.
---------------------------------


Comments
Post a Comment